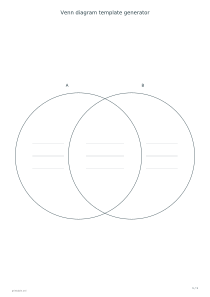
Make a printable Venn diagram with two or three overlapping sets. Add your own labels and notes, choose writing lines and export a clear comparison worksheet.
Live preview210 × 297 mm
A4
Preview is scaled to fit. The PDF keeps the exact dimensions.
PDF and Print include all pages. PNG and SVG save the page shown.
For true-size printing: choose 100% / Actual size, match the paper size and turn off headers and footers. Printing guide ↗
Ready for your printer
A Venn diagram makes shared and different characteristics visible in one place. It can organize a comparison of stories, materials, habitats or mathematical sets. This editor supplies the circular layout and separate writing regions; you decide what belongs in each part. Start with a blank template for discussion, or prepare a partly completed example that leaves a specific question for learners.
💡A few useful answers
Does the generator calculate the contents of an intersection?
No. You enter the labels and any region notes yourself. The worksheet does not parse conditions, calculate set operations or check whether an item belongs in the selected region. For a classroom exercise, agree on the membership rules first, and use the printed diagram to discuss or record the classification.
Can I make a completely blank Venn diagram?
Yes. Clear the region text and leave the default A, B and C labels, or replace them with your own short headings. Writing lines are optional. A blank template works well when participants will add examples during a discussion, because their choices remain visible rather than being implied by prepared notes.
Are the circle sizes a measure of the sets?
No. This template uses equal circles as a comparison framework. It does not encode the number of members, percentages or probabilities in their areas. If the relative sizes of groups are important to your explanation, state the counts separately instead of interpreting the drawn areas as quantitative evidence.
Choose what your sets represent
✏️Begin by naming the sets with clear, parallel labels. Two circles are suitable for comparing two characters, two objects or two classification rules. Three circles add several possible intersections, so introduce the third set only when those distinctions serve the activity. A crowded diagram is harder to discuss than a small comparison whose membership rules everyone understands.
The two-set layout has three writing regions: only A, only B and the overlap between A and B. A note in the overlap should satisfy both descriptions. For number activities, establish the rule before placing values; for example, multiples of two and multiples of three share numbers divisible by six. Prepare a separate numerical record on graph paper if calculations would obscure the comparison.
Keep the overlap meaningful
With three sets, there are seven interior regions. The pairwise overlaps mean membership in those two sets without the third, while the central intersection represents all three. This distinction matters when sorting examples. Saying that an item belongs to A and B does not yet establish whether it belongs in the pairwise region or in the center.
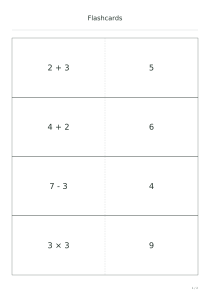
Each region accepts a short note of up to eighty grapheme clusters. Use a few specific words instead of a full essay, and consult the preview when working with longer labels. The tool does not analyze your notes, sort items automatically or check logical consistency. A set of printable flashcards can provide movable examples to classify before writing the final diagram.
Turn the diagram into a useful comparison
📝Enable writing lines for a worksheet that learners will complete by hand. Disable them for a clean diagram containing typed phrases or for an activity with small paper labels. Landscape orientation can make a three-set comparison easier to place alongside other lesson materials. The circle proportions adjust to the selected paper, while the membership relationships stay the same.
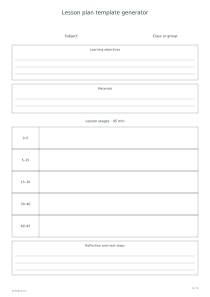
Use the completed diagram as a starting point for explanation. Ask why one example sits in an intersection and what change would move it elsewhere. Record the comparison objective in a lesson plan so that the drawing supports a definite learning task. Venn diagrams show overlapping membership; they are not proportional charts of population size, and the circle areas here do not represent measured quantities.
Venn diagram template generator
A two-set discussion sheet
Use two sets, A4 portrait and writing lines. Keep the default A and B labels and leave all region notes blank. The result is one sheet with three writing regions. Learners can add differences on the outside and shared characteristics in the central overlap.
Choose three sets, A4 landscape and no writing lines. Keep A, B and C as the labels and leave the notes empty. The one-page template exposes all seven interior regions, including the central intersection, ready for short handwritten labels or a guided classification activity.